intergenerational hogwash
part 2: ‘fairness’ and the triple lock
An anti-baby-boomer narrative is gathering momentum in the UK. Anti-boomer ideology has started to be reflected in government publications. It inspired the Conservatives’ recent threat to abolish the triple lock for the state pension.
Part 1 of this article is here.
Like other scapegoating ideologies, anti-boomerism has its buzz-phrases and pseudo-theoretical constructs. The key one in this case is “intergenerational fairness”. As noted, current use of this phrase is best understood in terms of a theory about unfair advantage supposedly possessed by the older generation.
The Intergenerational Foundation, for example, has constructed an index intended to measure what they regard as intergenerational fairness. By this measure, fairness increases if a state benefit is removed from the elderly – e.g. free bus travel, or the winter fuel allowance.
Fairness between individuals
The meaning of the term fair is notoriously subjective, rather like the related term moral. It seems relatively straightforward to say, in the hypothetical case of two individuals identical in every respect, that it seems unfair for them to be treated differently. Beyond that we are into the realm of personal taste. One person may think it unfair (e.g.) that the CEO of his phone company earns 100 times as much as his child’s schoolteacher. Another person may think differently.
This is not to say the concept of fairness is meaningless. It clearly exists in the sense that, across different cultures, humans seem to possess some version of it, possibly hard-wired. One can poll groups and get results as to whether members on average regard a given scenario as unfair. But the answers show dispersion within groups, the average answer varies between groups, and the results may not be very meaningful, given they are elicited under artificial conditions.
An unequal distribution between two apparently identical individuals may reflect random factors. Or one of the individuals may have taken actions which helped to bring about his larger share. However, the actions may either not have been intended to cause that particular result, or they may be of a kind which one would regard as legitimately bringing about the inequality, e.g. working harder.
Extreme egalitarians often seem confused over which type of inequality they should disapprove of most. Are some kinds of inequality acceptable because they reflect genetic traits, or effort, rather than the effect of environment? But is effort itself a function of genes, hence not under one’s control? And is it fair that people should benefit from having genes that tend to make them successful?
Fairness between generations
When we are dealing with large numbers of people, the issue of fairness is far more complex than when comparing two individuals. There are many ways to divide a heterogeneous population into two groups in such a way that the aggregate position of one appears to be better than that of the other. This is usually only meaningful as a difference in averages. Members of the top section of the “worse-off group” may all be better off than the bottom section of the “better-off group”.
To speak of one group being better off than another is therefore tendentious to begin with. It is easy for listeners to fall into the trap of assuming that the property better off applies to every member of the group. Things become more tendentious still when we start invoking ‘fairness’, particularly if it is implied that the better-off group somehow caused the asymmetry. Suggest that an unequal distribution has somehow been caused by the beneficiaries, and you can stir up a desire for them to suffer confiscation, or penalties.
Because there is nowadays a widespread assumption that it is the role of the community, via the state or otherwise, to rectify ‘unfairness’ whenever possible, assigning that label has different effects from those it had a hundred years ago. Now, if an accusation of unfairness is made, there may be immediate political implications. Those in positions of responsibility should be cautious about making such accusations, and cautious about adducing data in support of them.
For example, figures purporting to show comparisons of average wealth between the generations are usually presented in raw form, without any attempt to provide context. It is generally acknowledged that property inflation has become a major distorting factor both for the British economy and for individual households. One would acquire a more informative picture if figures about wealth were accompanied by the same data with property values excluded. However, this would not assist the anti-boomer narrative.
Adjusting for a fall in the purchasing power of the pound, UK property prices have risen on average about 30 percent per decade, almost trebling over the past forty years. A couple living in a property they bought in 1977 for Ł100,000 (in 2017 money) would be assigned a statistic for “current wealth” that might include Ł300,000 in respect of their house. Does it mean they are now better off by Ł200,000? Not if they need somewhere to live, and every other house also costs about Ł300,000.
House of Commons report on the triple lock
The concept of intergenerational fairness has led to calls for restricting payments made to the elderly, and has affected debates about the state pension, in particular the triple lock. These debates provide a good illustration of why assessments of fairness between groups can lead to policies that seem anything but fair for individuals.
The triple lock, introduced in 2010, is a slightly more generous method of calculating the annual increase in the state pension than previous methods. Its origins are complex and no doubt reflect political considerations. In part, however, the triple lock represented an attempt to remedy the deficiency of the basic state pension, allowing it to rise (very slowly) back towards a minimum income level.
We referred in part 1 to a House of Commons report published in November 2016. The report, by the Work and Pensions Committee, addressed the issue of state pensions in general and the triple lock in particular. Revealingly, it was not entitled Should the triple lock be retained? but Intergenerational Fairness. The political consensus at Westminster may already have been in favour of ditching the triple lock before the Committee started its work. If so, the anti-boomer narrative proved helpful, in that they were able to reach the desired conclusion with an appearance of moral correctness.
The report tries to provide evidence that the baby-boomer group has benefited unfairly from recent socioeconomic changes. A whole section is devoted to the rise in UK property values, and the fact that the incidence of home ownership among younger people is lower than in preceding decades.
The report cites economics professor James Sefton’s claim that
implicit in [the appreciation of property] is a large intergenerational transfer from young to old.
To express the rise in property prices in these terms is slanted. Implicit in Professor Sefton’s reference to “intergenerational transfer” is the claim that there was a redistribution, that it was involuntary, and that it should be reversed.
The report goes on to argue that pensioner poverty is no longer a serious problem, pointing out that median pensioners’ income is now “just above the working-age average”. Shiv Malik, co-author of Jilted Generation: How Britain Has Bankrupted Its Youth, is credited with the observation that
pensioners take home more from not working than people who do work, which is an astounding proposition.
Malik’s statement illustrates the drawback of making statements about groups. It would have been better to refer to “the average pensioner” and “the average person who works”. Even then, the effect of the statement might well have been to make one more likely to associate the word pensioner with the quality well-off.
The problem with these observations about poverty — and indeed with the report as a whole — is that for many individual pensioners, average figures for their age group are completely irrelevant.
The state pension is supposed to provide a basic income for people who are too old for employment, and many of the poorer members of this group depend on it as their only source of income. It is scarcely helpful to cite averages in deciding whether it is adequate, or indeed fair. The approach is as flawed as saying: “the average income of residents of Surrey is double that of those living in Cornwall; inter-county fairness would be restored by denying income support to anyone living in Surrey”.
How generous is the UK state pension?
Anecdotally, the current basic state pension — that part of the state pension that is available as of right, rather than as a means-tested benefit — is worth significantly less than it was forty years ago. Quantifying this is less straightforward than might appear.
Prior to 1980, the pension was uprated annually in line with the rise in average wages or prices, whichever was higher. The link to wages was introduced in 1974, perhaps partly because inflation was getting out of control. Average price inflation, which had swung between 2 and 5% per annum during the 1960s, rose above 8% at the start of the seventies. In the mid-seventies, it got significantly worse, rising above 20% for a couple of years.
In situations of high inflation, it is not merely the average pace of price increases that creates problems, but the unpredictability of terms for economic transactions generally. Prices do not helpfully go up at a rate that is the same for all goods and services, nor do wages respond congruently. Things become more subject to economic noise.
In 1979, in response to the prevailing monetary and fiscal crisis, Margaret Thatcher’s government cut the state pension’s link to wages. In subsequent years the pension was uprated only by reference to an average (“headline”) price index — for a long time the RPI, and then the CPI. This might seem to suggest that the value of the pension remained more or less constant after 1980, but that would be an oversimplification.
Inflation is usually assumed to be quantifiable by means of a single figure. However, price inflation is a more complex phenomenon than the concept described by economics textbooks. An index such as the RPI measures the cost of a collection of goods and services that is supposed to represent the average “basket” of expenditure for an entire population. But actual baskets vary from household to household, and the cost of the standard of living for a particular household can rise at a significantly higher rate than the average.
The chart below illustrates this effect. It is taken from a report by Abi Adams and Peter Levell, published by the Joseph Rowntree Foundation. Bullets show the average inflation rate, vertical bars the range of inflation experienced by different households in the UK. For example, the bar in red shows that for 2008, though headline inflation was around 4%, many households experienced rates of 6, 7 or even 8%. The variance for 2009 (in green) was even more pronounced.
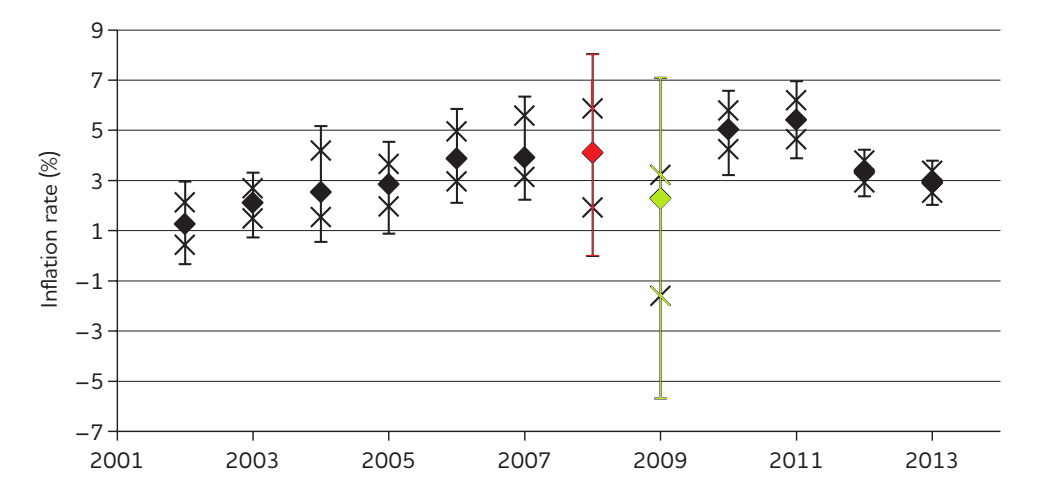
This divergence from the headline rate for individual households is not just a random effect. It can cause systematic errors when trying to assess the position of a particular income group over time. For example, over the period 2007 to 2013, a typical member of the top income group experienced price inflation of about 18%, while a typical member of the bottom income group experienced about 26% (my calculations).
Using a national average for inflation to uprate what is intended to be a minimum level of income becomes especially problematic when different sectors change prices at highly divergent rates, as may have been the case over the last 20 or 30 years. Thanks in part to the “Factory Asia” effect, the prices of some imported manufactured goods, particularly electronic devices, can seem as if they keep getting lower every year. A mobile phone can now be bought at a supermarket for £10, when twenty years ago it might have cost £50. On the other hand, the price of a Mars bar is said to have doubled over the same period – even before taking into account that it has got smaller.
When prices of different goods are moving in different directions, combining them in varying proportions can obviously produce a wide variety of answers to the question: how fast, on average, are prices rising? This may help to explain the anecdotal observation, repeatedly made during the course of the last twenty years, that the headline inflation rate is misleading, and that real inflation rates — at least in some sectors of the economy — are significantly higher than the figures cited by Bank of England officials.
The net effect of indexing the state pension solely to a headline inflation rate has been a gradual loss in its ability to finance a minimum standard of living.
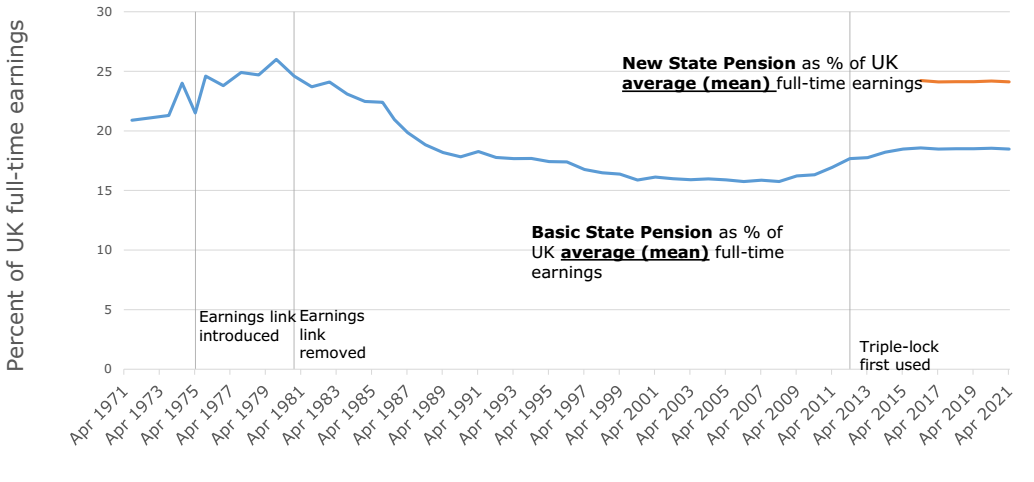
Some idea of the divergence between the state pension and minimum income is given by the graph below, taken from the House of Commons report. The blue line shows the basic state pension in relation to average (mean) wages declining over the period 1979 to 2005 from 26% to 16%.
As the state pension has fallen increasingly below the poverty line, the top-up benefit for pensioners (“pension credit”) has had to rise steadily to make up for the discrepancy. This top-up is means-tested and available to qualifying pensioners on application. Yet hundreds of thousands who are eligible for it do not claim it.
There has been considerable boggling over why many pensioners do not apply for benefits to which they are entitled. However, it is hardly surprising if a person in their seventies or eighties prefers not to make an application for something akin to the dole, thereby exposing themselves to official scrutiny. This is especially likely in the current climate, in which the judgment that an elderly person who appears scatterbrained would be better off under ‘professional’ supervision seems to be made relatively quickly.
The gradual divergence between state pension and minimum cost of living has occurred with the connivance of successive governments. The logic has been: resources should be allocated where they are most ‘needed’; pensioners who depend on the state pension can always get it topped up by applying for the pension credit; therefore we will allow the as-of-right component to “wither on the vine”.
This logic ignored the fact that many elderly people regard having to interact with government officials as something to be avoided; it also ignores the implicit ‘contract’ between the state and those who had paid voluntary national insurance contributions (see part 1).
According to data compiled by Loughborough’s Centre for Research in Social Policy, the basic state pension in 2014 was more than 30% below the cost of a minimum standard of living for a single person, excluding housing costs.
Remedial efforts
By the end of the 1990s the state pension had declined to about 17% of the mean wage. Uprating by reference to the headline rate of inflation was producing results that struck many as grossly inappropriate. Concern came to a head in 1999 when the RPI rise of 1.1% generated the lowest increase in the state pension since the 1960s, leading to widespread complaints. In response, the Labour government announced there would be a minimum annual increase of 2.5%. This was applied from 2002 onwards.
In 2005, the Turner Report noted that the basic state pension was still not keeping pace with the cost of living. The report recommended that the earnings link should be restored, to “stop the spread of means-testing”. It also recommended that a higher flat-rate pension should be introduced so that the means-tested element would eventually be eliminated altogether.
Although the Labour government agreed in principle to the report’s recommendations, the earnings link was not reintroduced until 2010. This reintroduction produced the triple lock: the pension would in future (voters were told) be uprated annually by the highest of three figures: average price inflation, average wage inflation, and 2.5%.
The Turner Report’s recommendation for a new, higher, flat-rate pension was adopted in 2014, and has applied to those retiring from April 2016 onwards. However, this still leaves pensioners who retired before that date, struggling to get by on a pension lower than a fifth of the mean national wage.
Since 2010 the result of the triple lock has been to raise the state pension — very slowly — from 16% to 18% of the mean wage. This remains well below what could be regarded as a minimum cost of living.
The positive effect of having a 2.5% minimum annual rise, on top of index-linking to prices and wages, is small and somewhat haphazard. In the absence of anything better, however, it is not to be despised. It is difficult to see the UK government coming up with a faster or more generous way of raising the pension to a minimum acceptable level. There already appears to be resentment about payouts to pensioners, which is being stoked by anti-boomer rhetoric.
A number of experts, including economists at the Institute for Fiscal Studies, have advised that the 2.5% rule is not worth retaining because it is “arbitrary” and “makes no sense”. If the effect of their advice is simply the rule’s removal, turning the triple lock into a double lock, or merely a link to earnings, the resulting system may well be less arbitrary. However, that will be little consolation for pensioners who lose their chance of one day receiving an adequate pension.
The triple lock represents a feeble attempt to restore the UK state pension — for retired people in their seventies and eighties — to something resembling what was promised and what is needed.
The argument that it would be fair to abolish it, citing as support the allegedly high average wealth of the baby-boomer group, makes no sense and is best understood as propaganda.
© Fabian Tassano
published 30 September 2017
notes
1. Information about the Intergenerational Foundation’s Fairness Index for 2016 is available here.
2. For data about house prices, see Nationwide’s House Price Index.
3. House of Commons report:
House of Commons Work and Pensions Committee, Intergenerational Fairness, HC59, 6 November 2016. Quotations are from pages 13, 21 and 22.
4. Chart showing range of different inflation rates for the same year is Figure 3 from:
Abi Adams and Peter Levell, Measuring poverty when inflation varies across households, Joseph Rowntree Foundation, 2014, p.17.
Colours added by present author.
The bars leave out the most extreme 10% at either end of the inflation distribution. Crosses represent quartiles.
5. Figure 9, ibid., implies an average inflation rate of about 3.9% for lowest-income individuals, and about 2.8% for highest-income individuals, over the period 2007/08 to 2013/14. Compounding these rates over six years gives 26% and 18% respectively.
6. Regarding Mars bar prices and sizes, see this article at vouchercloud.com.
7. Graph showing basic state pension in relation to the mean wage is Figure 13 from HC59.
The basic state pension in relation to the median wage is of the order of 30%. Why the Committee chose to use an average that is less supportive of its conclusions is unclear. The chart is very informative however, and there appears to be no equivalent in terms of the median wage that is readily available in the public domain.
Ironically, when the idea of a state pension fund was originally discussed, a number of politicians argued that the amount paid out would eventually be higher than the average wage.
8. Re the basic state pension being allowed to “wither on the vine”.
This phrase was actually used some years ago in a letter issued by the government department then dealing with pensions.
9. Re the basic state pension being more than 30% below minimum living standard.
See here for minimum income standard for single male pensioner in 2014, here for single female pensioner, both around Ł183 per week (before housing costs). Information about the “minimum income standard” is available here.
Basic state pension in 2014/15: Ł113.10 per week.
10. Re experts’ assertion that the triple lock makes no sense.
“There is little economic justification for this policy” — Head of Public Policy, Institute of Economic Affairs
“crazy [...] totally arbitrary” — Editorial Director, Institute of Economic Affairs
“no specific relationship to society or the economy” — Baroness Altmann, former Pensions Minister
“makes no sense” — Director, Institute for Fiscal Studies
11. The Oxford Dictionary defines propaganda as:
“information, especially of a biased or misleading nature, used to promote a political cause or point of view”.
I think this fits The Pinch-style data, being invoked to justify limiting state pension uprating, fairly well.